I was introduced to the Du Pont Analysis by a couple of work colleagues who have formal accounting backgrounds. It is a relatively straightforward calculation using data that is available in an organisation’s standard financial records.
Formula and Calculation of DuPont Analysis
(extracted from the Investopia article on this topic)
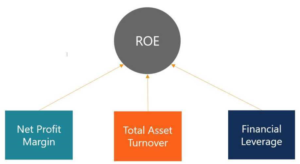
The Dupont analysis is an expanded ROE (return on equity) formula, calculated by multiplying the net profit margin by the asset turnover by the equity multiplier.
DuPont Analysis = Net Profit Margin × AT × EM
where:
- Net Profit Margin = Net Income / Revenue
- AT (Asset Turnover) = Sales / Average Total Assets
- EM (Equity multiplier) = Average Total Assets / Average Shareholders’ Equity
Why Use the DuPont Analysis?
A DuPont analysis is used to evaluate the component parts of a company’s return on equity (ROE). This allows you to determine what financial activities are contributing the most to the changes in ROE. Use the analysis to compare the operational efficiency of two similar firms. Managers can use DuPont analysis to identify strengths or weaknesses that should be addressed.
Other Financial Metrics, Your Business Health
If you told me your age, height, weight, resting pulse and blood pressure, I could make a pretty accurate estimate of your general health and wellbeing. If we dug a bit deeper, with blood and DNA tests, it would be possible to predict your lifespan and healthspan (i.e. the quality of those remaining years) with a high degree of confidence.
Aim to identify similar metrics in your business. These will include some obvious things like revenue, gross profit and net profit. Depending on the nature of your business model, there should be some key leading indicators (i.e. forward-looking) such as website views or new products under development, and some lagging indicators (measures of past performance), these might include your net promoter score or staff turnover rate. Aim to identify one or two strong indicators for each sector of the business model – marketing, sales, production, HR etc and avoid developing a list of 100 metrics, that would be unmanageable. Regularly review these key metrics to keep a finger on the pulse.